library(tidyverse)
library(janitor)
library(ggsci)
theme_set(theme_bw()+theme(text=element_text(size=30)))19 基础知识
19.1 连续型随机变量
df<-data.frame(x=seq(-5,5,by=0.01)) %>%
  mutate(pdf=dnorm(x),cdf=pnorm(x),icdf=qnorm(cdf))

df
19.1.1 密度函数/分布函数
df %>%
  ggplot(aes(x,pdf))+
  geom_line()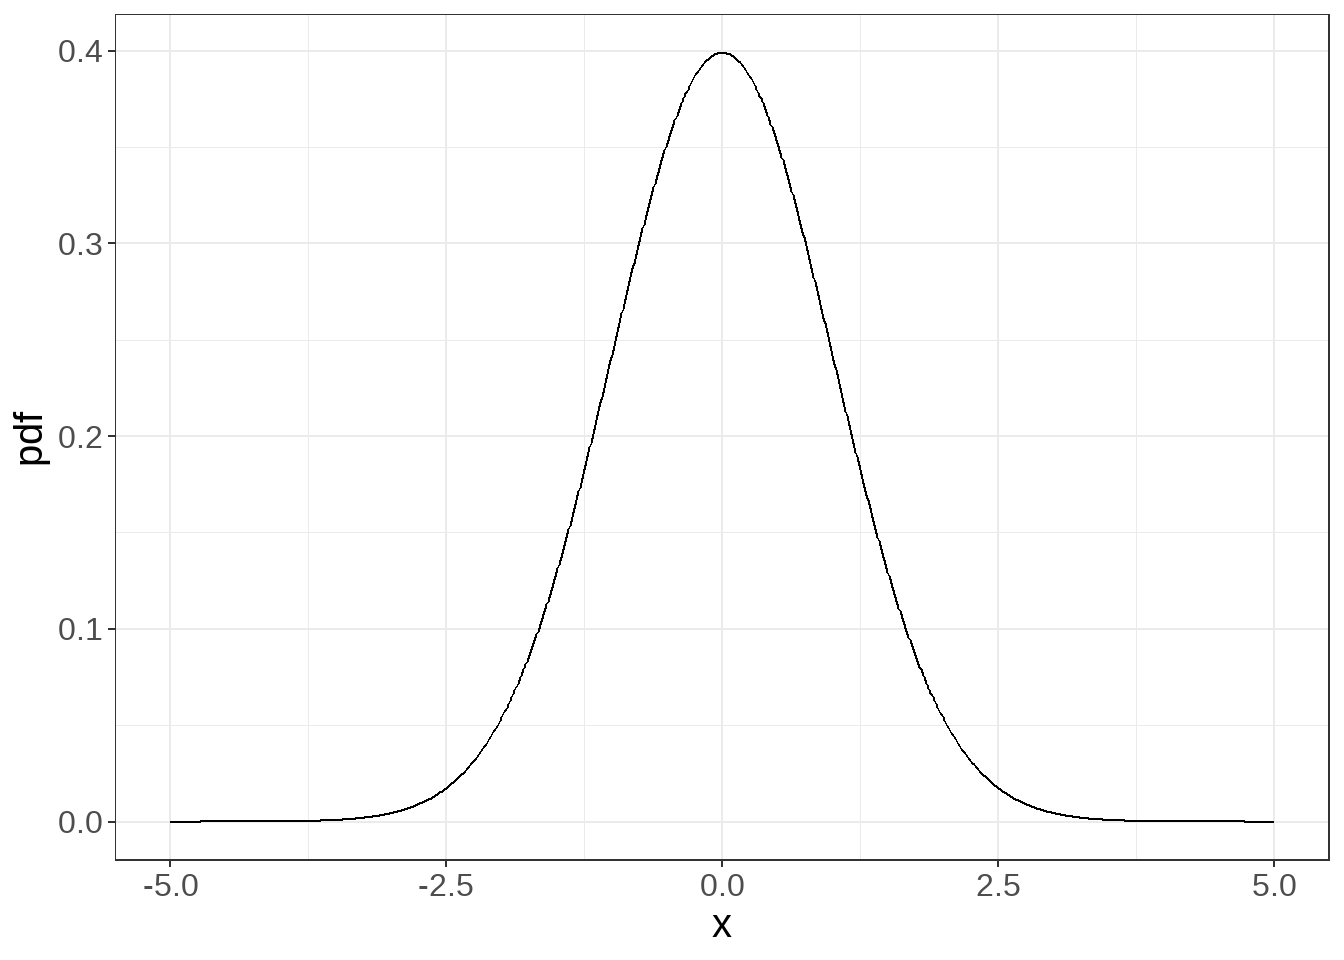
df %>%
  ggplot(aes(x,cdf))+
  geom_line()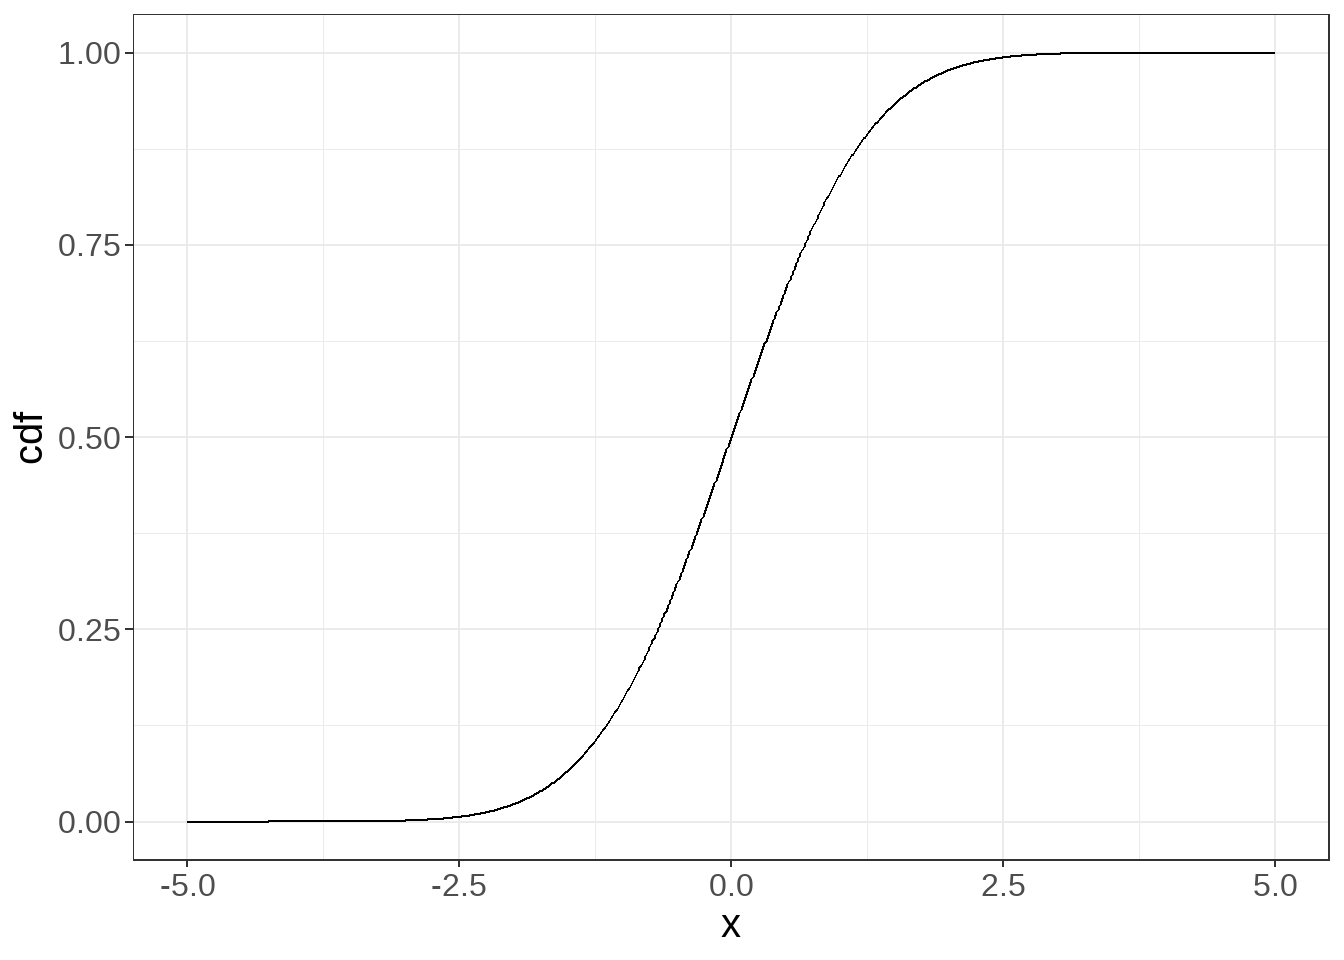
df %>%
  ggplot(aes(cdf,icdf))+
  geom_line()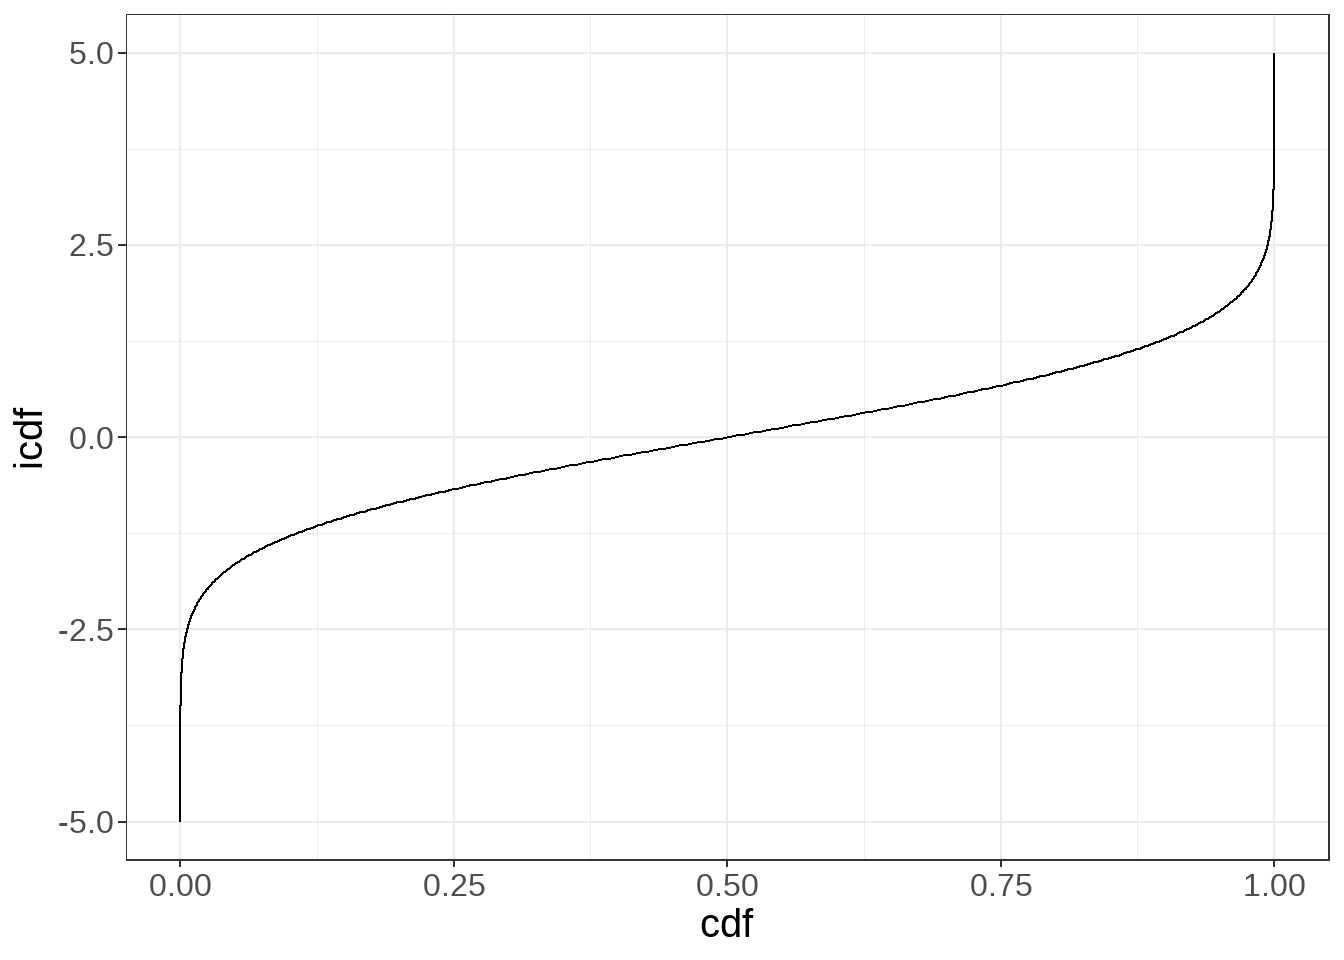
19.1.2 3\(\sigma\)(西格玛)准则
ggplot(df,aes(x,pdf))+
  geom_line()+
  geom_area(aes(x=ifelse(abs(x)<3,x,NA),fill='0.9974'),alpha=0.5)+
  geom_area(aes(x=ifelse(abs(x)<2,x,NA),fill='0.9545'),alpha=0.5)+
  geom_area(aes(x=ifelse(abs(x)<1,x,NA),fill='0.6827'),alpha=0.5)+
  geom_vline(xintercept =c(-3,-2,-1,1,2,3),linetype='dashed')+
  scale_x_continuous(breaks=c(-5:5))+
  labs(x='Z',y='概率密度(pdf)')+
  scale_fill_futurama()+
  guides(fill=guide_legend(title='曲线下面积',override.aes = list(alpha=0.2)))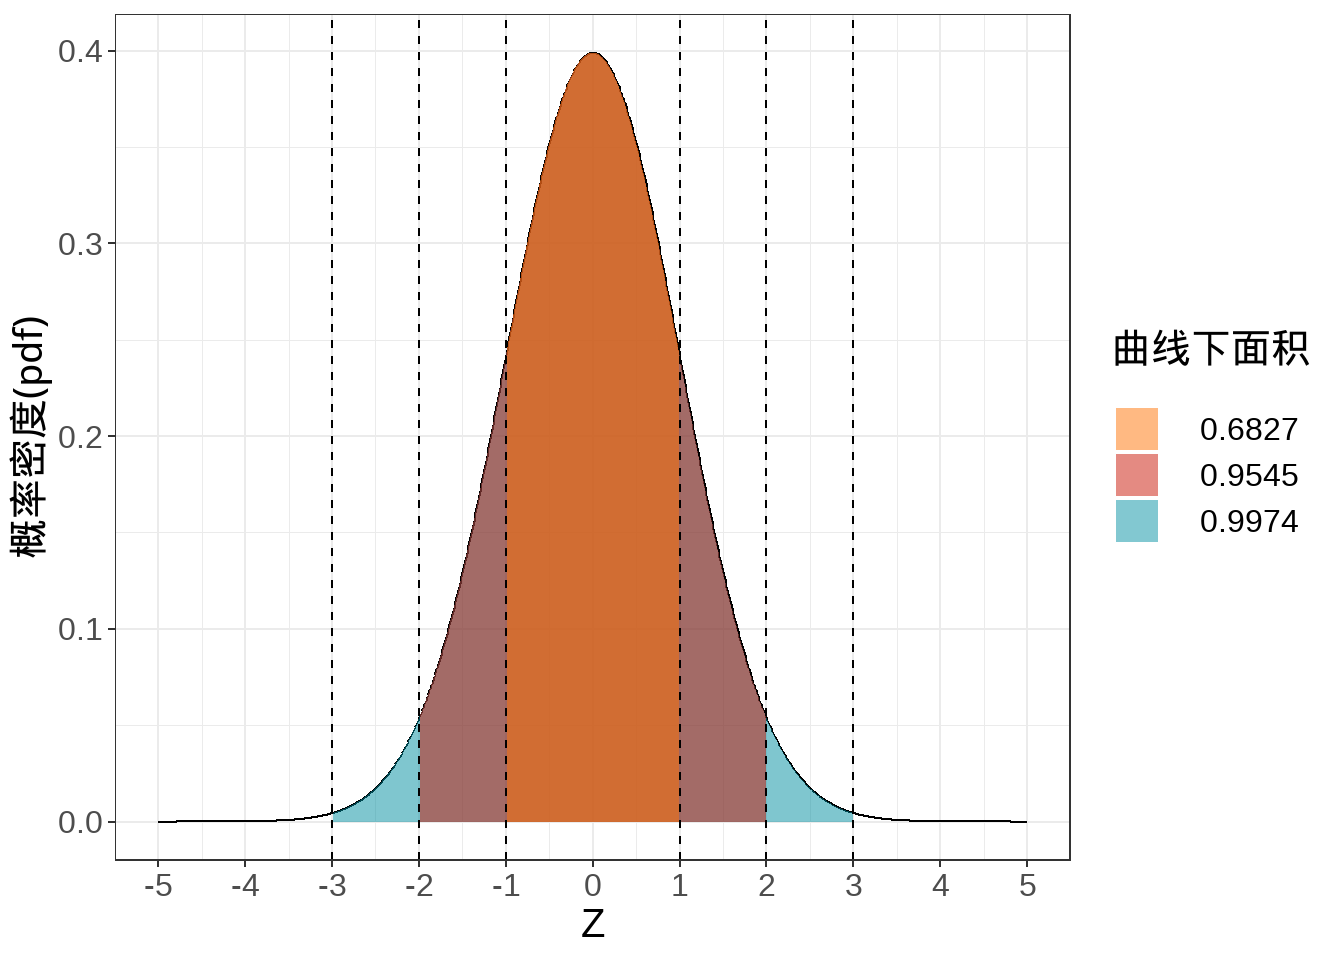
pnorm(1:3)-pnorm(-1:-3)[1] 0.6826895 0.9544997 0.9973002(pnorm(1:3)-pnorm(-1:-3)) %>%
`/`(2) %>%
`-`(0.5,.) %>%
qnorm()[1] -1 -2 -319.1.3 Z检验界值和参考值范围
-qnorm(c(0.005,0.01,0.025,0.05,0.1))[1] 2.575829 2.326348 1.959964 1.644854 1.281552-qnorm(c(0.005,0.01,0.025,0.05,0.1)) %>%
pnorm()[1] 0.995 0.990 0.975 0.950 0.90019.1.4 频率分布直方图
runif(10000) %>%
  qnorm() %>%
  hist(breaks = 50)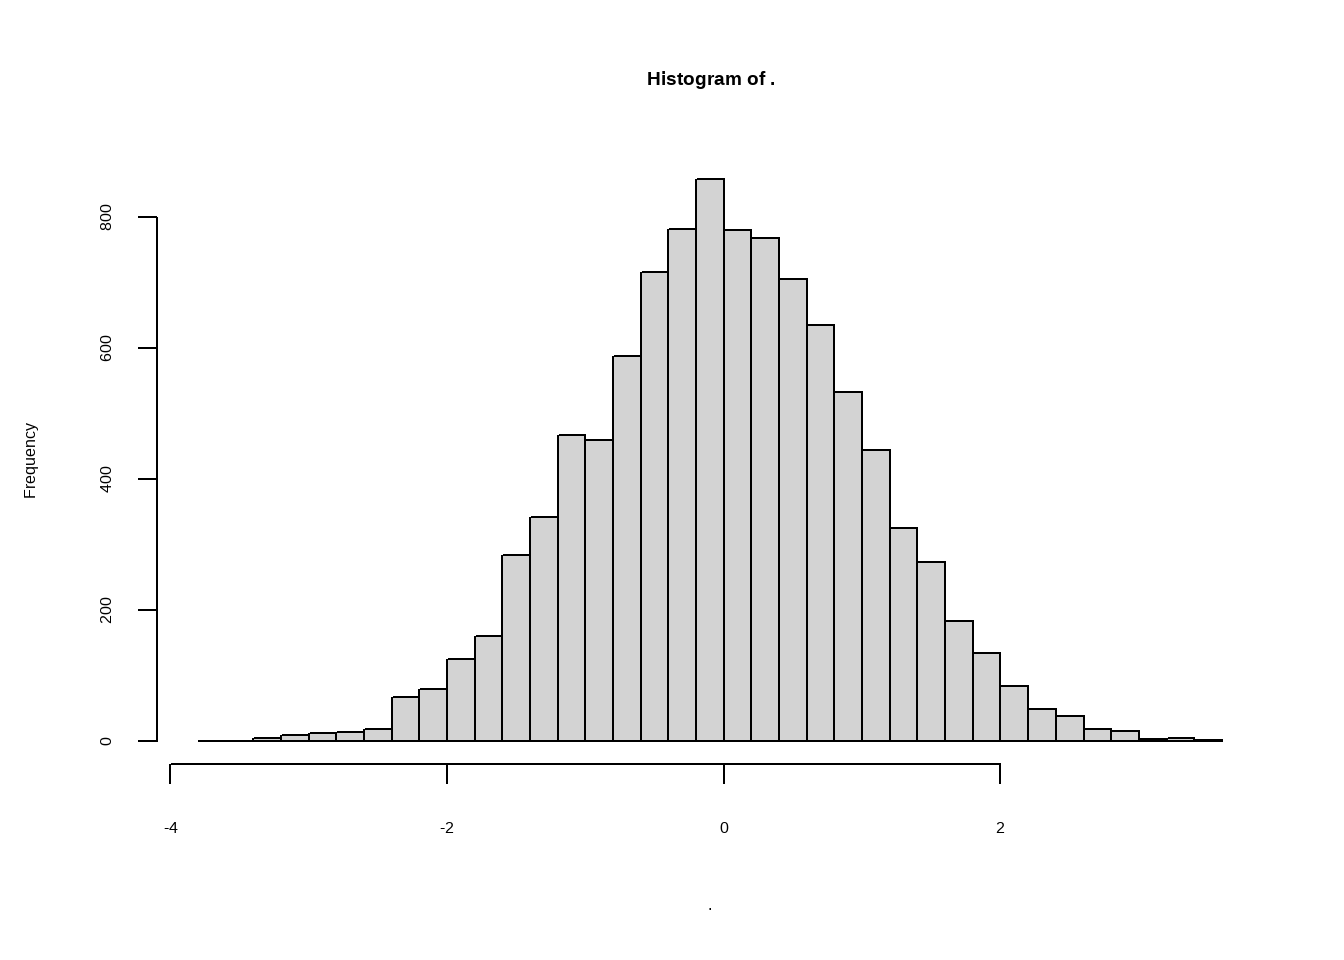
19.2 离散型随机变量
19.2.1 分布列
rpois(1000,5) %>%
  table() %>% as.data.frame() %>%
  setNames(c('k','probality')) %>%
  adorn_percentages(denominator = 'col') %>%
  ggplot(aes(k,probality))+
  geom_col()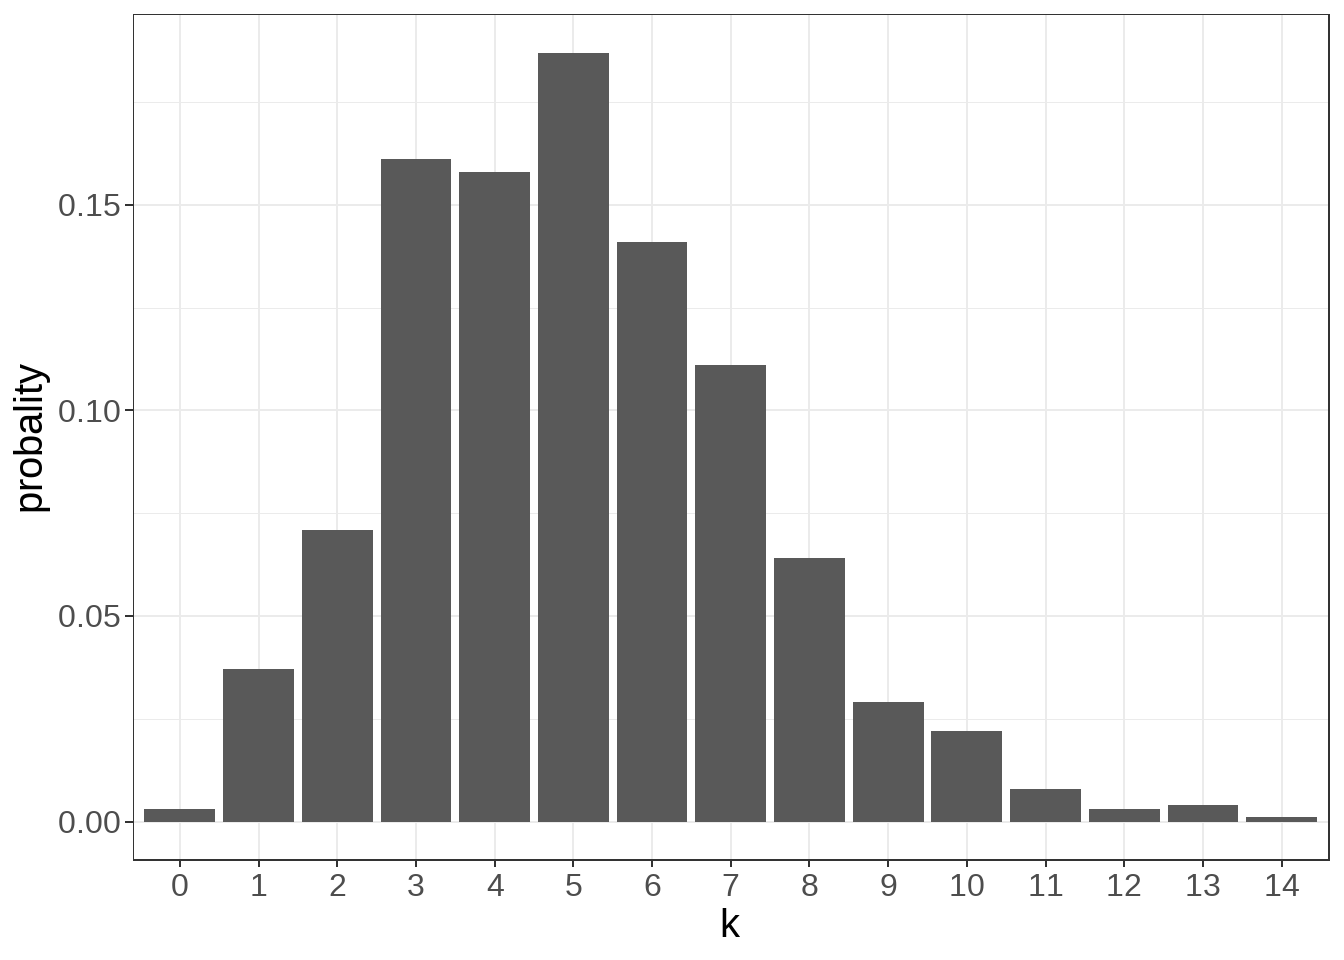
19.3 95%CI的含义
df<-data.frame(miu=runif(1000,min=1,max=100),sigma=runif(1000,min=1,max=20)) %>%
  rowwise() %>%
  mutate(sample=list(rnorm(25,miu,sigma)),
         x_bar=mean(sample),
         sd=sd(sample),
         ci_lower=x_bar-1.96*sd/5,
         ci_upper=x_bar+1.96*sd/5,
         within_ci=ifelse(miu>=ci_lower & miu <=ci_upper,T,F)) %>%
  mutate(across(where(is.numeric),~round(.x,2)))

dfmean(df$within_ci)[1] 0.938